Count implicit gaps
Usage
count_gaps(
  .data,
  .full = FALSE,
  .name = c(".from", ".to", ".n"),
  .start = NULL,
  .end = NULL
)
Arguments
Value
A tibble contains:
the "key" of the
tbl_ts".from": the starting time point of the gap
".to": the ending time point of the gap
".n": the number of implicit missing observations during the time period
See also
Other implicit gaps handling:
fill_gaps(),
has_gaps(),
scan_gaps()
Examples
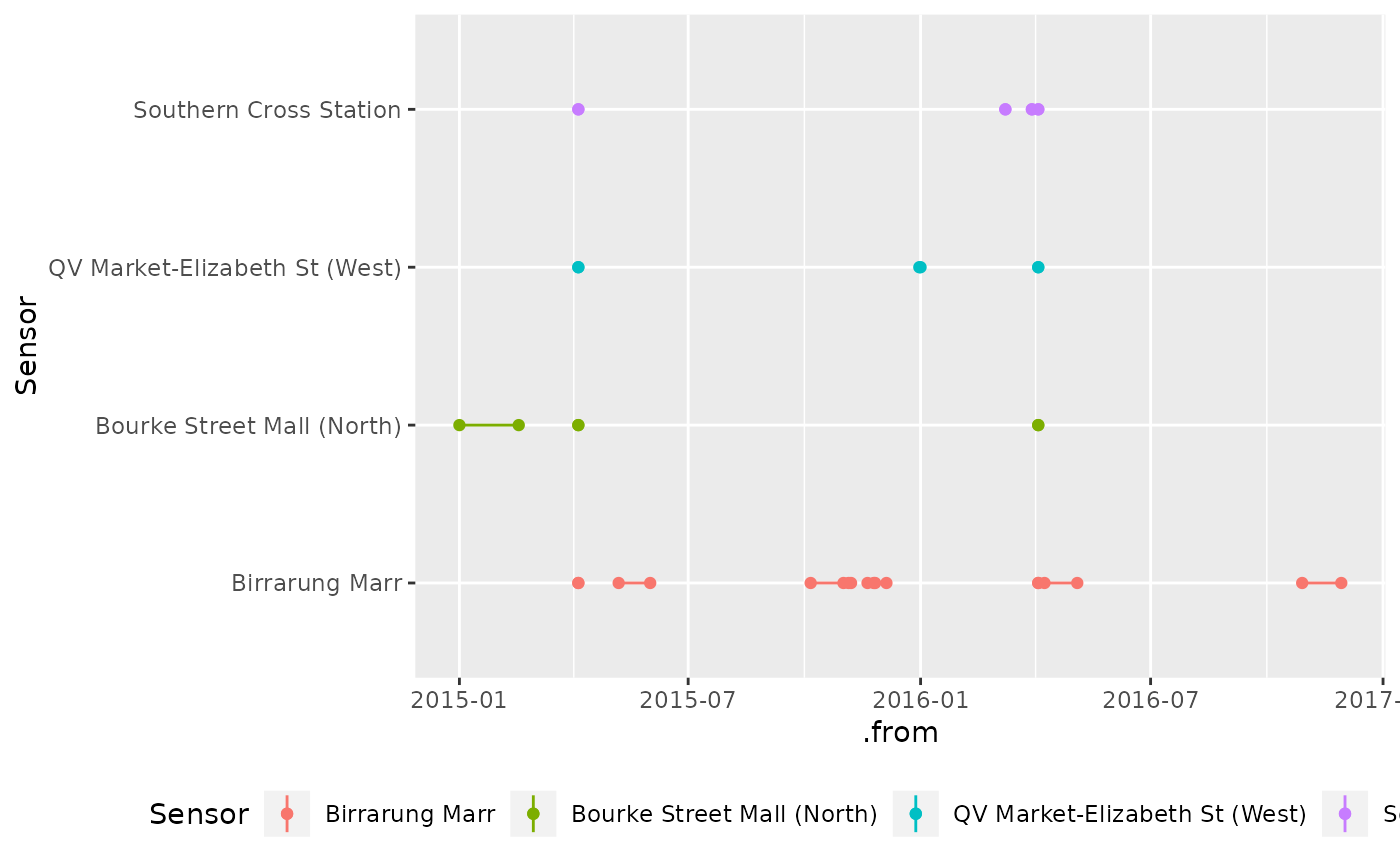
ped_gaps <- pedestrian %>%
  count_gaps(.full = TRUE)
ped_gaps
#> # A tibble: 19 × 4
#>    Sensor                        .from               .to                    .n
#>    <chr>                         <dttm>              <dttm>              <int>
#>  1 Birrarung Marr                2015-04-05 02:00:00 2015-04-05 02:00:00     1
#>  2 Birrarung Marr                2015-05-07 00:00:00 2015-05-31 23:00:00   600
#>  3 Birrarung Marr                2015-10-06 00:00:00 2015-10-31 23:00:00   624
#>  4 Birrarung Marr                2015-11-05 00:00:00 2015-11-06 23:00:00    48
#>  5 Birrarung Marr                2015-11-20 00:00:00 2015-11-24 23:00:00   120
#>  6 Birrarung Marr                2015-11-26 00:00:00 2015-12-04 23:00:00   216
#>  7 Birrarung Marr                2016-04-03 02:00:00 2016-04-03 02:00:00     1
#>  8 Birrarung Marr                2016-04-08 00:00:00 2016-05-03 23:00:00   624
#>  9 Birrarung Marr                2016-10-29 00:00:00 2016-11-28 23:00:00   744
#> 10 Bourke Street Mall (North)    2015-01-01 00:00:00 2015-02-16 23:00:00  1128
#> 11 Bourke Street Mall (North)    2015-04-05 02:00:00 2015-04-05 02:00:00     1
#> 12 Bourke Street Mall (North)    2016-04-03 02:00:00 2016-04-03 02:00:00     1
#> 13 QV Market-Elizabeth St (West) 2015-04-05 02:00:00 2015-04-05 02:00:00     1
#> 14 QV Market-Elizabeth St (West) 2015-12-31 00:00:00 2015-12-31 23:00:00    24
#> 15 QV Market-Elizabeth St (West) 2016-04-03 02:00:00 2016-04-03 02:00:00     1
#> 16 Southern Cross Station        2015-04-05 02:00:00 2015-04-05 02:00:00     1
#> 17 Southern Cross Station        2016-03-08 02:00:00 2016-03-08 02:00:00     1
#> 18 Southern Cross Station        2016-03-29 02:00:00 2016-03-29 03:00:00     2
#> 19 Southern Cross Station        2016-04-03 02:00:00 2016-04-03 02:00:00     1
if (!requireNamespace("ggplot2", quietly = TRUE)) {
  stop("Please install the ggplot2 package to run these following examples.")
}
library(ggplot2)
ggplot(ped_gaps, aes(x = Sensor, colour = Sensor)) +
  geom_linerange(aes(ymin = .from, ymax = .to)) +
  geom_point(aes(y = .from)) +
  geom_point(aes(y = .to)) +
  coord_flip() +
  theme(legend.position = "bottom")

